Projects
← Back to ProjectsB2C Revenue Concentration
BigQuery customer-level modeling · Revenue concentration (quartiles) · Retention leverage (order buckets)
I built a customer-level model from line-item transactions to quantify revenue concentration, identify “whales,” and surface repeat-purchase thresholds where LTV begins to compound. Outputs were visualized in Looker Studio to show how these levers can translate into lifecycle and retention actions.
Dataset & environment
Environment
Platform: BigQuery (Standard SQL)
Raw data
- Scale: 541,909 line items
- Invoices: 25,900 invoices
- Customers: 4,372 customers
Modeling subset
- Line items: 397,924 line items
- Orders: 18,536 orders
- Customers: 4,339 customers
Filters used for customer-level modeling: CustomerID IS NOT NULL, Quantity > 0, exclude cancellations (InvoiceNo starts with 'C').
The problem
- Grain risk: line-item transaction tables can distort customer metrics unless normalized to order-grain first
- Concentration unknown: revenue often concentrates in a minority of customers, but the degree is rarely quantified
- Retention needs a lever: teams need an actionable threshold (e.g., 1→2 purchases) that creates compounding value
Core insight
Revenue follows a heavy-tailed distribution: most customers contribute modest value, while a small cohort compounds LTV through repeat purchasing. The goal is to quantify concentration and identify the repeat thresholds where value ramps.
Visual insights
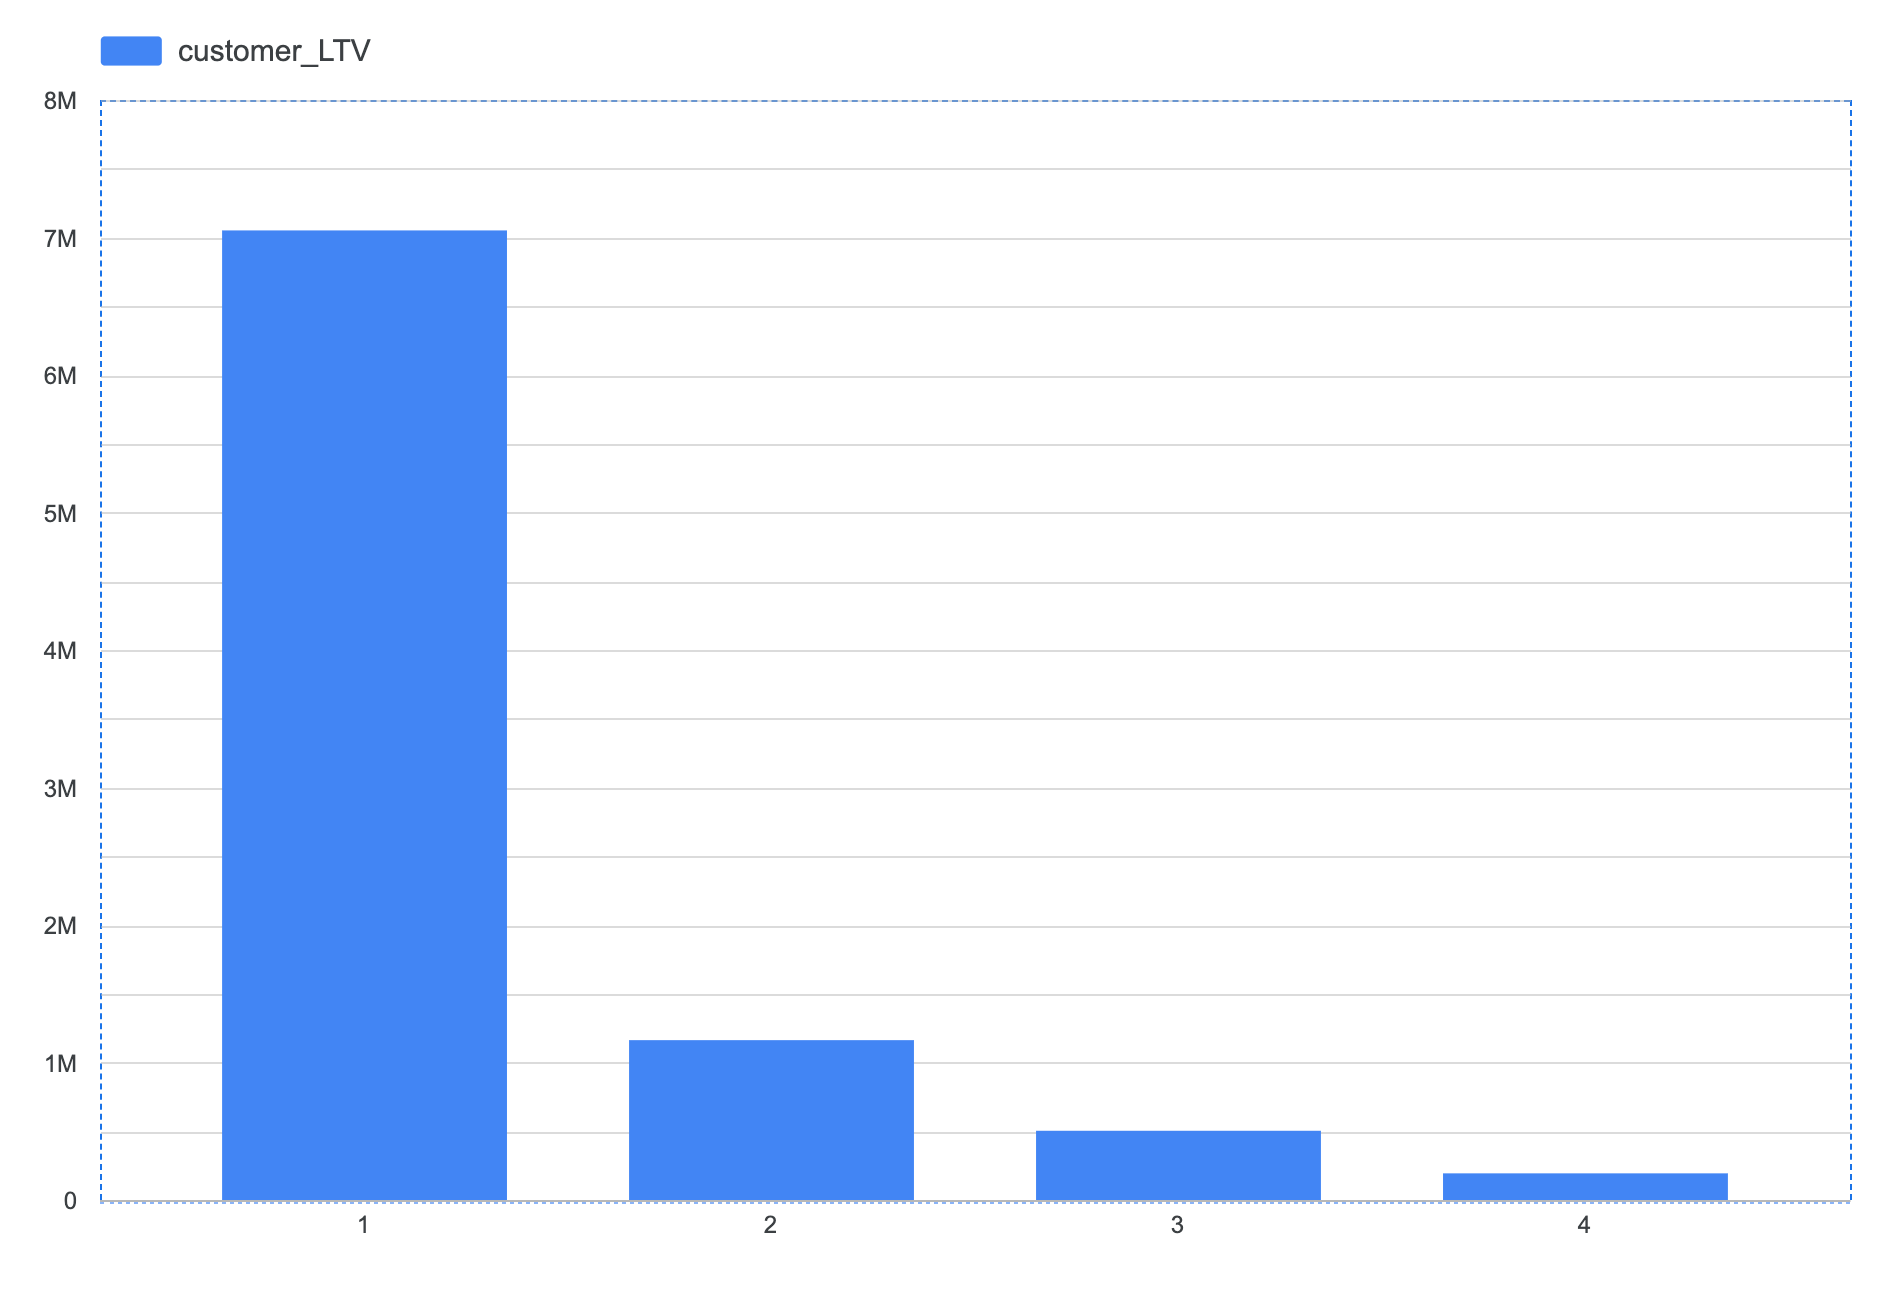
Total customer LTV aggregated by quartile (NTILE(4) over customer_LTV).
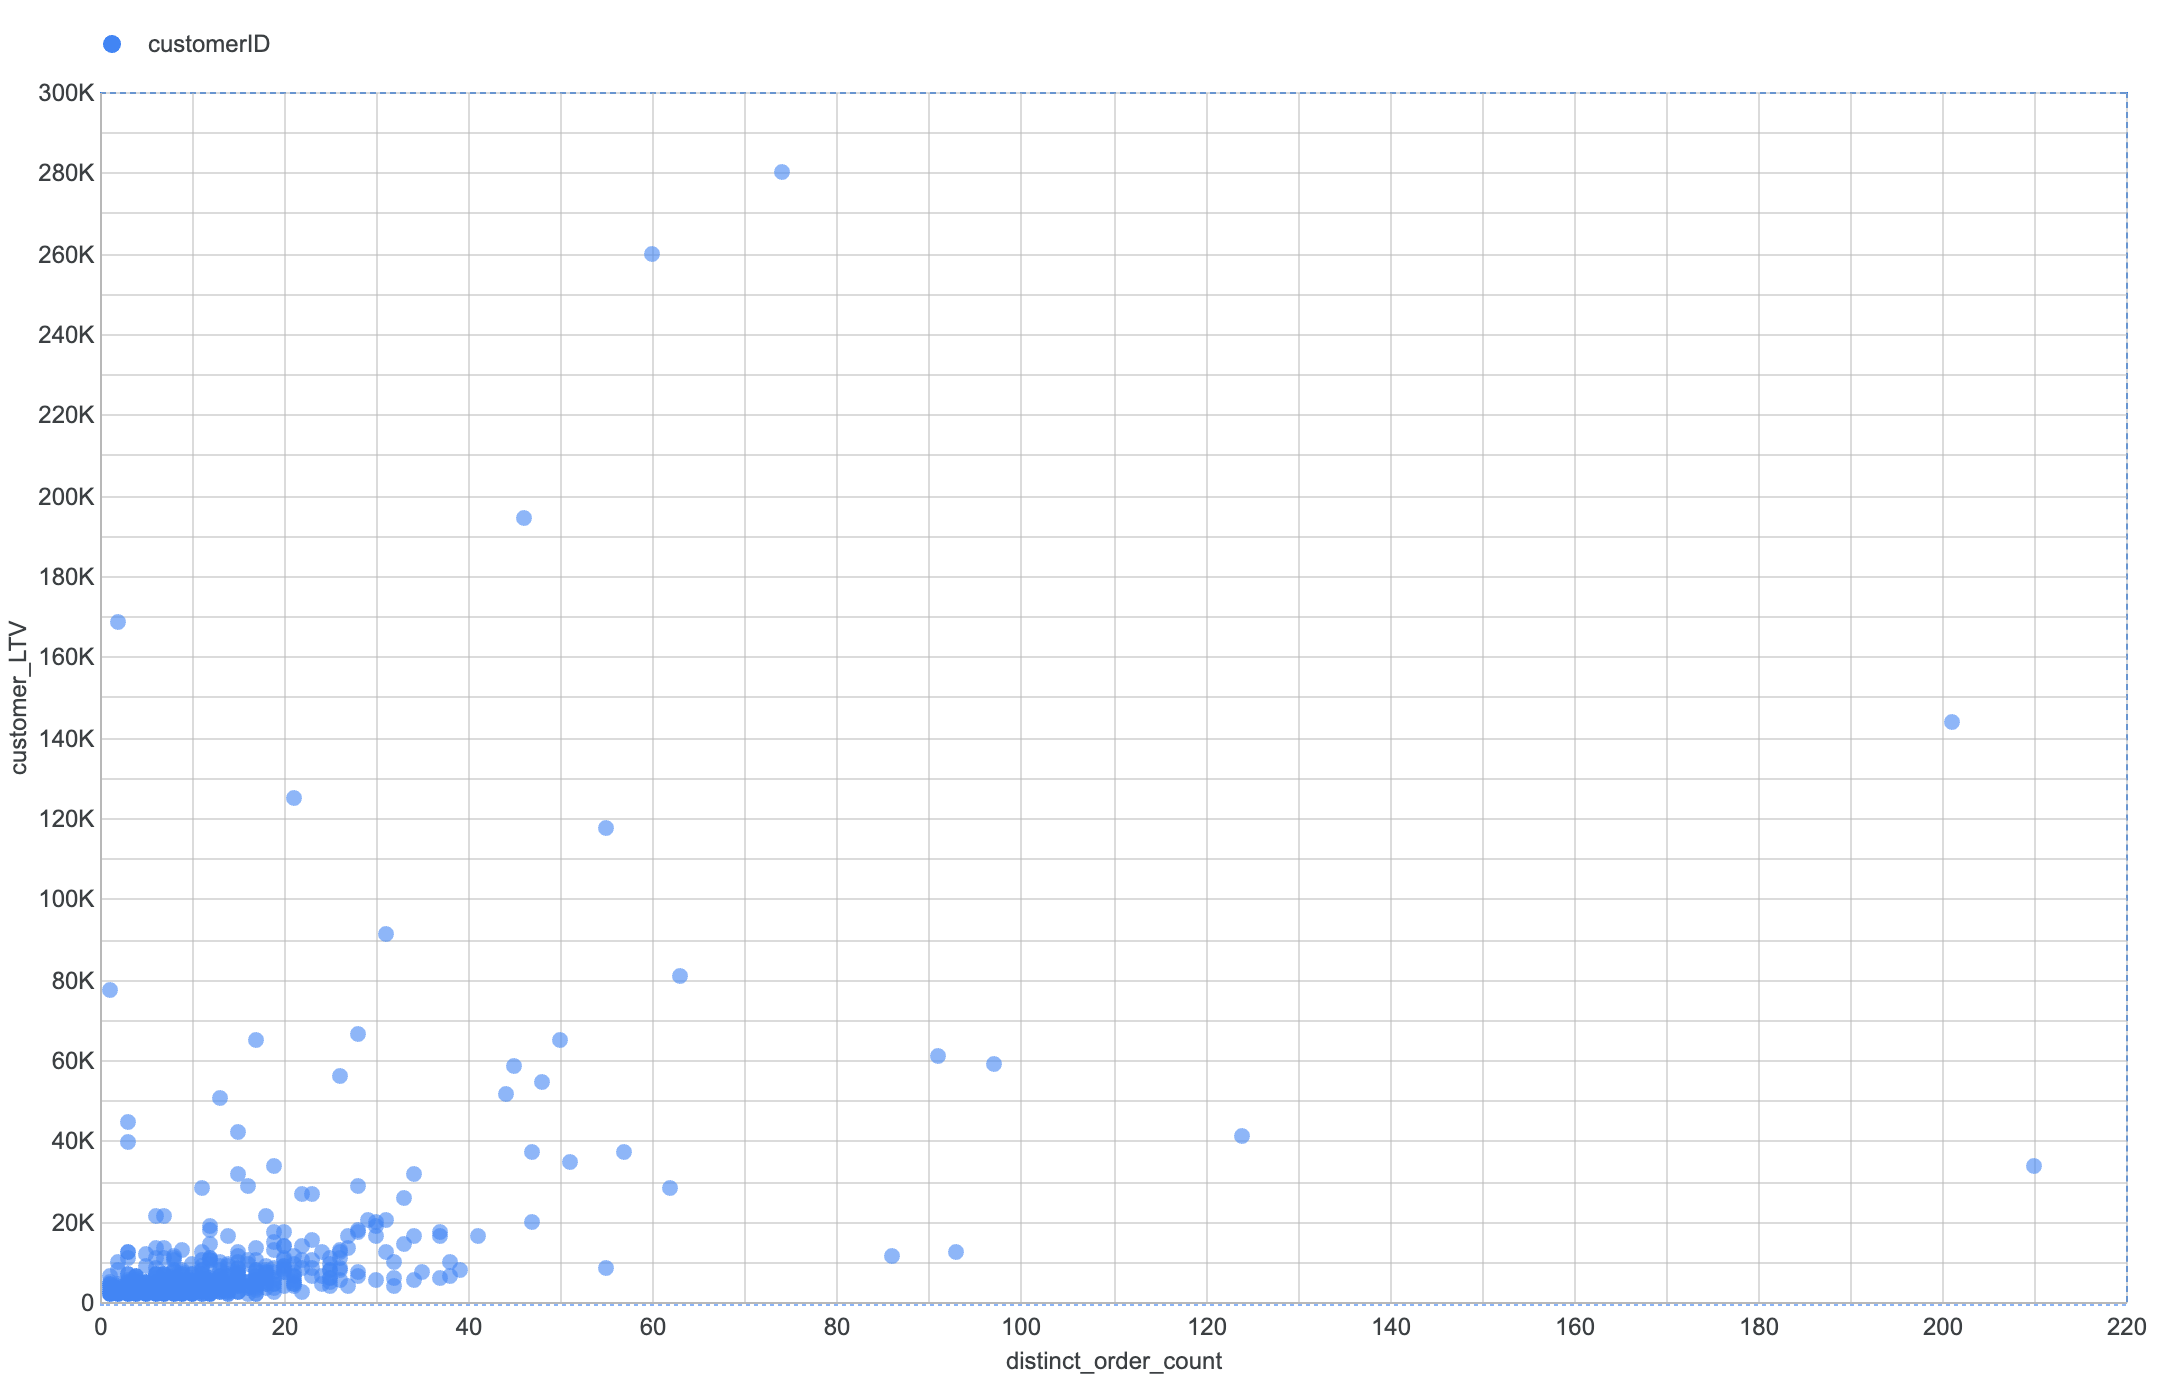
Customer-level scatter highlighting the heavy tail (distinct_order_count vs customer_LTV).
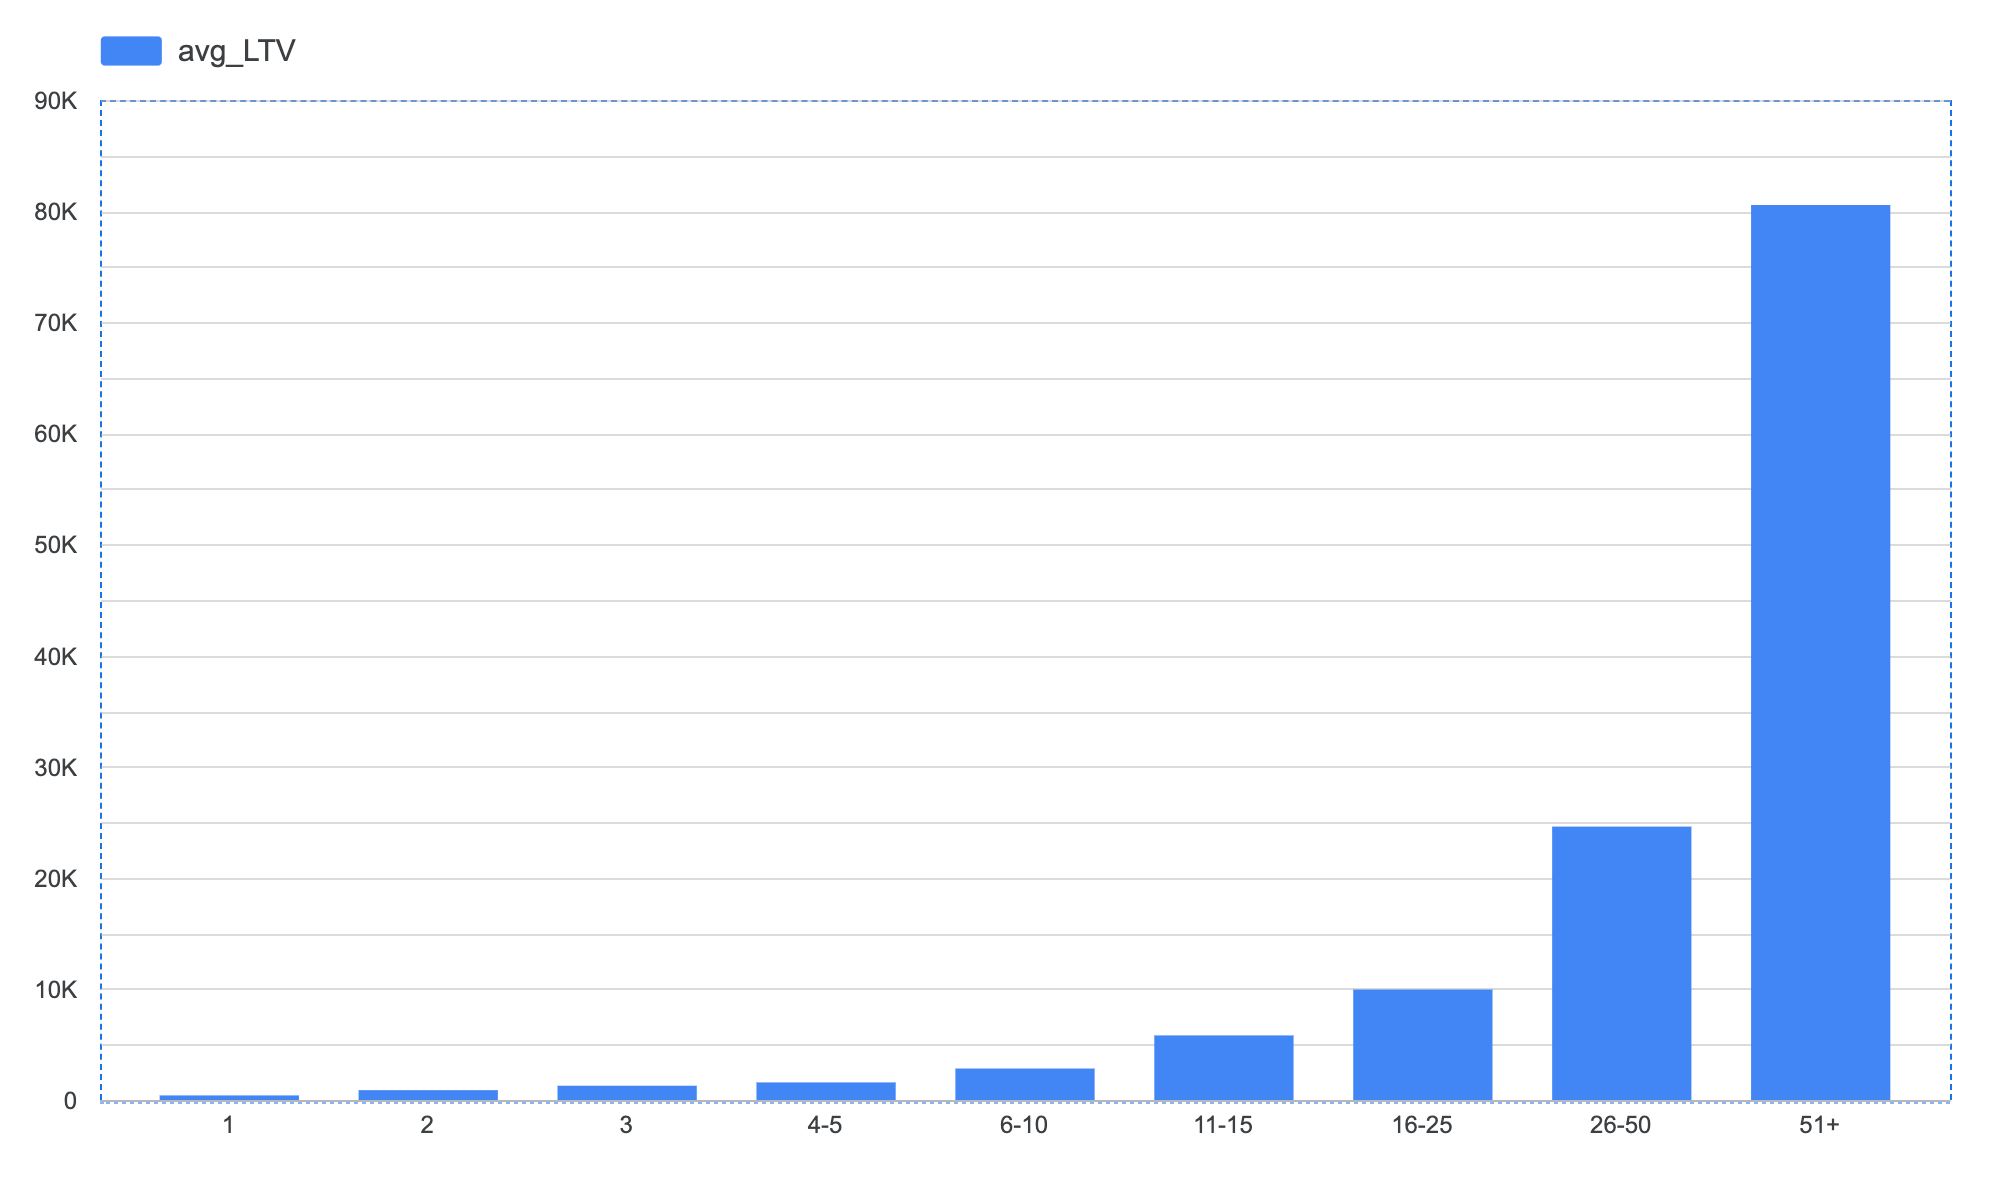
Buckets (1 → 51+) separate typical repeat customers from high-frequency power buyers.
Key findings
- Revenue is concentrated: the top quartile contributes the majority of total LTV.
- LTV scales non-linearly with repeat behavior: clear “power buyer” tiers emerge as order count increases.
- Buckets reduce whale distortion: “11+” is not one segment—“51+” behaves materially differently.
Operational implications
- Lifecycle focus: prioritize 1→2 purchase conversion as the broadest scalable lift.
- Early VIP detection: flag customers approaching 16+ orders for proactive retention.
- Triggered moments: use cadence signals to time replenishment and winback outreach.
Technical implementation
The model controls grain (line-items → orders → customers), excludes cancellation/refund noise, then uses window functions and explicit bucketing to quantify concentration and retention leverage in a way that maps cleanly to BI charts.
Architecture highlights
- Order-grain normalization prevents double-counting customer revenue
- Cancellation handling excludes refunded orders (InvoiceNo begins with “C”)
- Explicit bucketing keeps segments stable and interpretable
- Chart-ready outputs to reduce BI layer complexity
What I optimized for
- Correctness across grain changes
- Readable, modular CTEs for maintainability
- Direct mapping from query output → chart
- Stable segment definitions (explicit bucket ordering)
SQL excerpt
View SQL excerpt (grain + refund hygiene + buckets)
-- BigQuery (Standard SQL)
-- Line items → order grain → customer metrics → retention leverage buckets

WITH order_grain AS (
  SELECT
    CustomerID AS customerID,
    InvoiceNo  AS invoiceNo,
    MIN(TIMESTAMP(InvoiceDate)) AS order_ts,
    SUM(Quantity * UnitPrice)   AS order_revenue
  FROM `emerald-mission-476520-a8.customer_segmentation.customer_segmentation`
  WHERE CustomerID IS NOT NULL
    AND Quantity > 0
    AND NOT STARTS_WITH(CAST(InvoiceNo AS STRING), 'C') -- exclude cancellations/refunds
  GROUP BY CustomerID, InvoiceNo
),

customer_metrics AS (
  SELECT
    customerID,
    COUNT(DISTINCT invoiceNo) AS distinct_order_count,
    SUM(order_revenue)        AS customer_LTV
  FROM order_grain
  GROUP BY customerID
),

bucketed AS (
  SELECT
    CASE
      WHEN distinct_order_count = 1 THEN '1'
      WHEN distinct_order_count = 2 THEN '2'
      WHEN distinct_order_count = 3 THEN '3'
      WHEN distinct_order_count BETWEEN 4 AND 5 THEN '4-5'
      WHEN distinct_order_count BETWEEN 6 AND 10 THEN '6-10'
      WHEN distinct_order_count BETWEEN 11 AND 15 THEN '11-15'
      WHEN distinct_order_count BETWEEN 16 AND 25 THEN '16-25'
      WHEN distinct_order_count BETWEEN 26 AND 50 THEN '26-50'
      ELSE '51+'
    END AS order_bucket,
    customer_LTV
  FROM customer_metrics
)

SELECT
  order_bucket,
  COUNT(*)          AS customers,
  AVG(customer_LTV) AS avg_LTV
FROM bucketed
GROUP BY order_bucket
ORDER BY
  CASE order_bucket
    WHEN '1' THEN 1
    WHEN '2' THEN 2
    WHEN '3' THEN 3
    WHEN '4-5' THEN 4
    WHEN '6-10' THEN 5
    WHEN '11-15' THEN 6
    WHEN '16-25' THEN 7
    WHEN '26-50' THEN 8
    ELSE 9
  END;
Outcome
This model quantifies revenue concentration, isolates high-value behavior tiers, and turns raw transactions into retention levers that can be operationalized through lifecycle automation and VIP programs.